IBM uses data analytics to map Vivid visitor movements
- 30 May, 2014 08:43
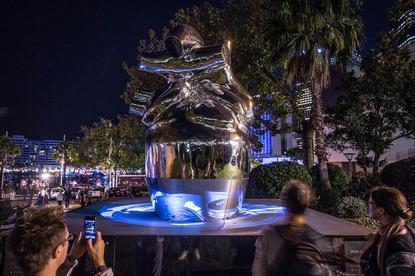
IBM's Heart of the City sculpture. Photo credit: IBM.
IBM has deployed data analytics technology at its Heart of the City lighting sculpture in Sydney to map visitor movement and interaction at this year’s Vivid Festival.
The vendor is using Wi-Fi signal data coming from the smartphones and tablets of visitors to map and visualise real-time movement around the 40 light exhibitions installed around Circular Quay. According to an IBM spokesperson, these visitor movement patterns are then projected on to the vendor’s lighting sculpture.
“It reflects what’s going on at street level. This data reveals patterns that can be used for future planning such as patterns based on times of day, visitor numbers, their dwell time, the direction they headed and the pace they walked at,” the spokesperson commented.
“Understanding how visitors move around large-scale public events can help Vivid festival organisers' better plan to enhance visitor experiences.”
- Sportsbet’s top 3 data visualisation commandments
- 8 ways to get on top of data analytics
- How data analytics is helping Reachout.com to save lives
IBM’s sculpture uses PresenceZones location-based software and Wi-Fi infrastructure from its business partner, Ruckus Wireless.
According to IBM, the wireless signal data is only detected along the Vivid Light Walk, and is fully encrypted. No personal information is captured.
This is the first time the vendor has taken part in the 18-day Vivid Sydney festival which runs until 9 June.
Follow CMO on Twitter: @CMOAustralia, take part in the CMO Australia conversation on LinkedIn: CMO Australia, or join us on Facebook: https://www.facebook.com/CMOAustralia