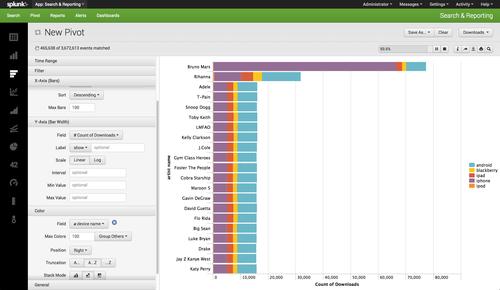
Splunk's new Pivot capability allows users to easily create new charts and data visualizations
Splunk continues to enhance its flagship machine data search engine so it can be used by business analysts and managers, in addition to its typical audience of system and network administrators.
The newly released Splunks Enterprise 6 includes new capabilities to easily visualize data, as well as a framework to build Web applications based on Splunk data, said Sanjay Mehta, the company's vice president of product marketing.
General business managers may also have a lot to learn from machine data, Mehta explained. For instance, for marketing executives, Splunk could provide a list of what types of smartphones are being using to access an organization's Web application, giving a manager a better idea of which phones to optimize for.
The Splunk search engine made its name for being able to easily search through log files and other forms of machine-generated data, allowing administrators to more easily pinpoint trouble spots or detect operational trends.
At the Splunk annual user conference, being held this week in Las Vegas, the company announced a number of new customers, including financial firm IG Group, U.S. wireless telecommunications provider T-Mobile, the U.S. Department of Energy's Oak Ridge National Laboratory, and Latin American online retail giant B2W.
For the past few years, Splunk has been adding more business intelligence capabilities to its namesake engine. Mehta would not offer an estimate of the percentage of Splunk's users deploying the software for analyzing data for purposes other than system administration, but did say it was a growing percentage of the user base.
One new feature, called Pivot, provides an easy way to build visual representations of data, through a drag-and-drop interface. Users can query different data sources and build reports -- without learning the Splunk query language.
Splunk Pivot can visualize and compare data sets using bar charts, pie charts, gauges and other common formats for data visualization. When the chart is clicked on, Splunk provides access to the underlying data set. Users can also import information from other sources, such as data from relational databases, to add to the data set being examined.
The software also allows users to build data models. The models help users better understand the relationships between different fields of data. The user interface has also been updated to make it easier to personalize.
Splunk 6 brings some to features to those who manage the software as well. Cluster management has been simplified, as has the process of fowarding data to Splunk instances across multiple geographic regions. The software also processes analysis requests up to 1,000 times faster than the previous edition, Splunk 5.
This edition also includes a Web framework designed to provide an easy way to build Splunk-based Web applications, using popular Web technologies such as JavaScript and the Django framework.
Joab Jackson covers enterprise software and general technology breaking news for The IDG News Service. Follow Joab on Twitter at @Joab_Jackson. Joab's e-mail address is Joab_Jackson@idg.com
In the third and final episode of our 3-part CMO50 video series exploring modern marketing and why it’s become a matter of trust, we’re delighted to be joined by Telstra’s former CMO and now digital services and sales executive, Jeremy Nicholas, and Adobe VP Marketing Asia-Pacific and Japan, Duncan Egan.
Flash back to the classic film, Willy Wonka and the Chocolate Factory. Television-obsessed Mike insists on becoming the first person to be ‘sent by Wonkavision’, dematerialising on one end, pixel by pixel, and materialising in another space. His cinematic dreams are realised thanks to rash decisions as he is shrunken down to fit the digital universe, followed by a trip to the taffy puller to return to normal size.
Why is it there is no shortage of leadership development materials, yet outstanding leadership is so rare? Despite having access to so many leadership principles, tools, systems and processes, why is it so hard to develop and improve as a leader?
As a nation united by sport, brands are beginning to learn money alone won’t talk without aligned values and action. If recent events with major leagues and their players have shown us anything, it’s the next generation of athletes are standing by what they believe in – and they won’t let their values be superseded by money.